
Over the last two decades the crime rate in the US declined sharply. According to statistics from the FBI, violent crime fell by 50% between 1993 and 2015.
However, people’s perception of crime does not always coincide with the official statistics. For example, research conducted by the online Gallup, indicate that the majority of Americans from year to year I believe that crime rates have risen significantly compared to last year, even though the facts show otherwise. The number of those who are afraid to walk around your neighborhood or the neighborhood at night is also increasing.

The topic of security on the streets of U.S. cities, as well as the crime trends are on many. Niche, a company dedicated to the collection of information and compilation of reviews of various cities, recently published an interesting ranking – the ranking of the most safe cities in the United States in 2017.
The researchers analyzed the data on crime, including acquisitive and violent crime. The study is the official data such as U.S. census and FBI data. They also reviewed more than 100 million reviews from users who have rated how safe they feel in their cities. The ranking shows that California, which includes 9 of the 25 most safest cities in the USA, is the leader.
The study revealed a pattern. The most secure city in the States have a small population and Vice versa. In areas where there is active traffic, crimes are less than in quiet areas.
Here is a ranking of the safest cities in the United States:
25. McAllen, Texas
 depositphotos
Population: 136 993.
The number of violent crimes (e.g., assault, murder) per 100,000 population per year: 107
Number of property crimes (e.g., burglary, theft of motor vehicles) per 100,000 population per year: 3 298
24. Boulder, Colorado
 depositphotos
Population: 103 919 people.
The number of violent crimes per 100,000 population per year: 208
The number of property crimes per 100 000 population per year: 2 465
23. Bellevue, Washington
 depositphotos
Population: 134 630 people.
The number of violent crimes per 100,000 population per year: 110
The number of property crimes per 100 000 population for the year: 3127
22. Torrance, California
 depositphotos Torrance, USA
Population: 147 589 people.
The number of violent crimes per 100 000 population for the year: 143
The number of property crimes per 100 000 population per year: 1930
21. College Station, Texas
 depositphotos
Population: 101 141 people.
The number of violent crimes per 100,000 population per year: 222
The number of property crimes per 100 000 population for the year: 2319
20. Santa Clara, California
 depositphotos
Santa Clara, California
Population: 121 374 people.
The number of violent crimes per 100,000 population per year: 126
The number of property crimes per 100 000 population for the year: 2897
19. Rochester, Minnesota
 depositphotos Skyline of Rochester, Minnesota
Population: 110 275 people.
The number of violent crimes per 100,000 population per year: 176
The number of property crimes per 100 000 population for the year 2263
18. Boise, Idaho
 depositphotos Beautiful capitol building in Boise, Idaho USA
Population: 214 196 people.
The number of violent crimes per 100,000 population per year: 308
The number of property crimes per 100 000 population for the year: 2275
17. Fort Collins, Colorado
 depositphotos aerial view of a local park with basketball courts, parking lot and baseball field in Fort Collins, Colorado, shot from a low flying drone at sunrise
Population: 153 of 292 people.
The number of violent crimes per 100,000 population per year: 196
The number of property crimes per 100 000 population for the year: 2516
16. Richardson, Texas
 depositphotos
Population: 106 of 123 people.
The number of violent crimes per 100,000 population per year: 151
The number of property crimes per 100 000 population for the year: 2004
15. Burbank, California
 depositphotos BURBANK
Population: 104 725 people.
The number of violent crimes per 100,000 population per year: 150
The number of property crimes per 100 000 population for the year: 2510
14. Overland Park, Kansas
 depositphotos
Population: 181 464 people.
The number of violent crimes per 100,000 population per year: 214
The number of property crimes per 100 000 population per year: 1842
13. Temecula, California
 depositphotos
Population: 107 of 153 people.
The number of violent crimes per 100,000 population per year: 102
The number of property crimes per 100 000 population for the year: 2612
12. Glendale, California
 depositphotos
Downtown Glendale next to Los Angeles in southern California.
Population: 196 984 people.
The number of violent crimes per 100 000 population for the year: 95
The number of property crimes per 100 000 population for the year 1736
11. Plano, Texas
 depositphotos
Population: 275 645 people.
The number of violent crimes per 100,000 population per year: 152
The number of property crimes per 100 000 population for the year 1799
10. Cape Coral, Florida
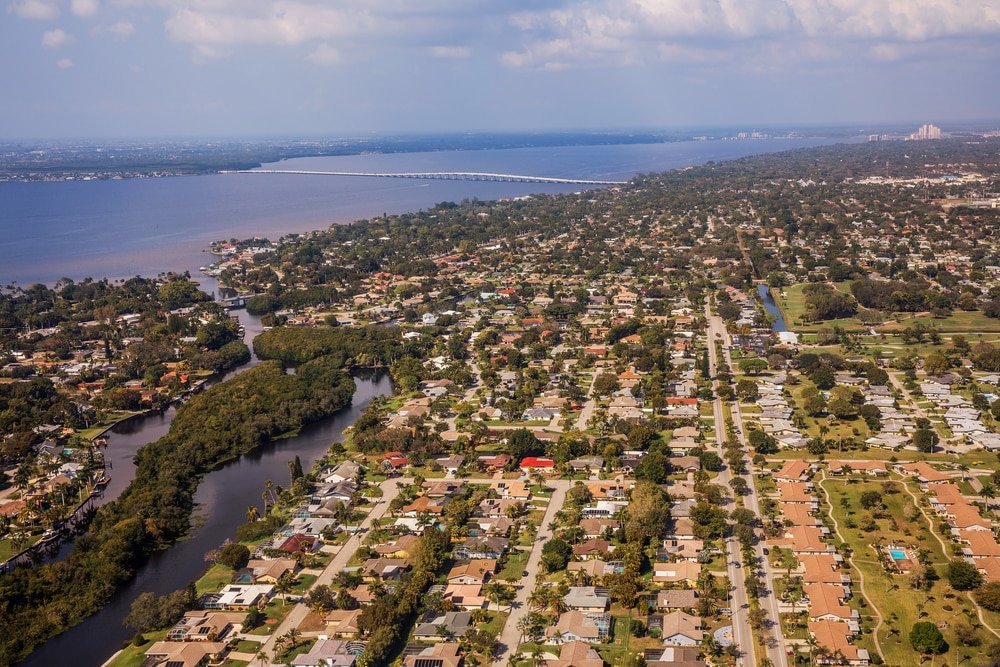 depositphotos
Population: 165 843.
The number of violent crimes per 100,000 population per year: 116
The number of property crimes per 100 000 population per year: 1804
9. Sunnyvale, California
 depositphotos Sunnyvale, California, United States — August 15, 2016: flags in front of Yahoo Headquarters with American Flag and flag with Yahoo icon. Yahoo is a multinational technology company.
Population: 148 178 people.
The number of violent crimes per 100,000 population per year: 104
The number of property crimes per 100 000 population for the year: 1545
8. Port St. Lucie, Florida
 depositphotos
Population: 172 054.
The number of violent crimes per 100,000 population per year: 147
The number of property crimes per 100 000 population for the year: 1364
7. Carlsbad, California
 Depositphotos Rows of colorful flowers grow on a hillside in Carlsbad, California.
Population: 110 830 people.
The number of violent crimes per 100,000 population per year: 151
The number of property crimes per 100 000 population per year: 1873
6. Ann Arbor, Michigan
 depositphotos
Population: 194 116.
The number of violent crimes per 100,000 population per year: 192
The number of property crimes per 100 000 population for the year: 1992
5. Round Rock, Texas
 depositphotos Brushy Creek Falls in Autumn in Round Rock, Texas, USA
Population: 109 690 people.
The number of violent crimes per 100 000 population for the year: 132
The number of property crimes per 100 000 population for the year 1924
4. Provo, Utah
 depositphotos Scenic overhead view of the Provo River in Utah, United States.
Population: 115 345 people.
The number of violent crimes per 100 000 population for the year: 133
The number of property crimes per 100 000 population for the year 2040
3. Thousand Oaks, California
 depositphotos Springtime Bush Sunflower wildflower field in Wildwood Regional Park above the Los Angeles suburb of Thousand Oaks, California.
Population: 128 565 people.
The number of violent crimes per 100,000 population per year: 105
The number of property crimes per 100 000 population for the year: 1213
2. Irvine, California
 Depositphotos View of Balboa Island, and buildings in Irvine
Population: 238 474 people.
The number of violent crimes per 100,000 population per year: 55
The number of property crimes per 100 000 population for the year: 1499
1. Naperville, Illinois
 depositphotos Naperville, IL, USA — October 7, 2012: Statue of Dick Tracy Along the Riverwalk in Naperville, Illinois
Population: 114 058 person.
The number of violent crimes per 100 000 population for the year: 87
The number of property crimes per 100 000 population for the year: 1122
